If you are planning to show a report on “Course Completion Rates” to the CFO’s (Chief Financial Officer) office as a ROI proof, then you have already lost the argument right there. These kinds of reports and data are just vanity metrics for a Finance Director. The course completion report only tells that employees are acquiring compliance certificates. It’s just a black box between money going in and certificates coming out, it doesn’t guarantee if the performance actually improved.
Modern day learning and development has drastically shifted and it focuses more on “training for impact”. It now uses newer and more advanced architecture. Instead of relying on SCORM based content and tracking, eLearning developers now use high-fidelity xAPI analytics which provides more granular tracking and analysis that correlate learning behaviours with business KPIs.
In this article we will walk you through the blueprint for providing the ROI with learning analytics, and why your choice of infrastructure dictates your financial success.
The Vanity Metrics and their Liability
Organizations that are still stuck with SCORM are just sitting in the data graveyard. SCORM based LMS will only tell them that their:
Employee XYZ passed a quiz with a 90% score.
If you take a report with such information to the CFO you will be asked: “Does this mean that the chance of the XYZ employee performing without making an error is 90%?” and you don’t have any answer for that, SCORM doesn’t tell you much.
This blackbox is a financial liability, there is no correlation between the training and performance and it will result in training becoming the first budget cut during a downturn.
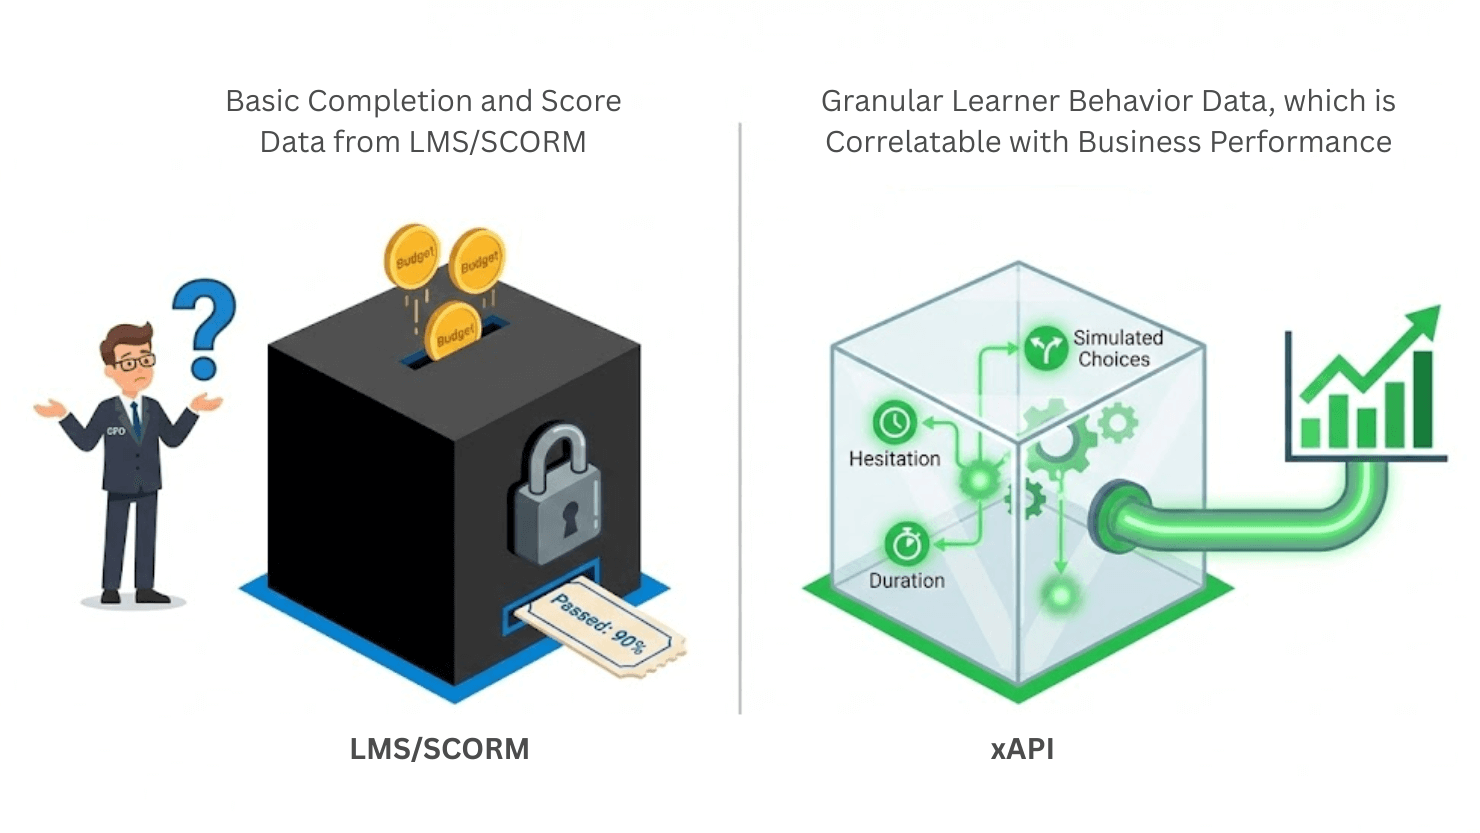
This is where xAPI (Experience API) steps in with more drilled down granular tracking and data. From limited information such as Pass/Fail and score to detailed learner behavior such as Hesitation, Repetition, Duration, and Skipping, now you have data to see in depth interaction to understand employee’s learning pattern and their performance. To solve the issue of vanity metrics you will need to include tools like LRS (Learning Record Store).
Define the Strategy: Internal vs. External Impact
Before implementing the technology that allows you to prove ROI, you must define the primary purpose of the training so that you know what data to gather for the CFO.
Internal Training
If it’s employee training then the training goal is to improve either employees’ effectiveness or efficiency. And to measure that you can focus on:
- Time to Competency: Analyze how much time it takes a new hire to become productive. Reducing the duration will save the company significant salary cost.
- Error Reduction: Check reduction in refunds, wastes, or support tickets and correlate with the training data. This will prove direct cost saving.
- Employee Retention: Improving employee retention saves the high cost associated with hiring and training new staff.
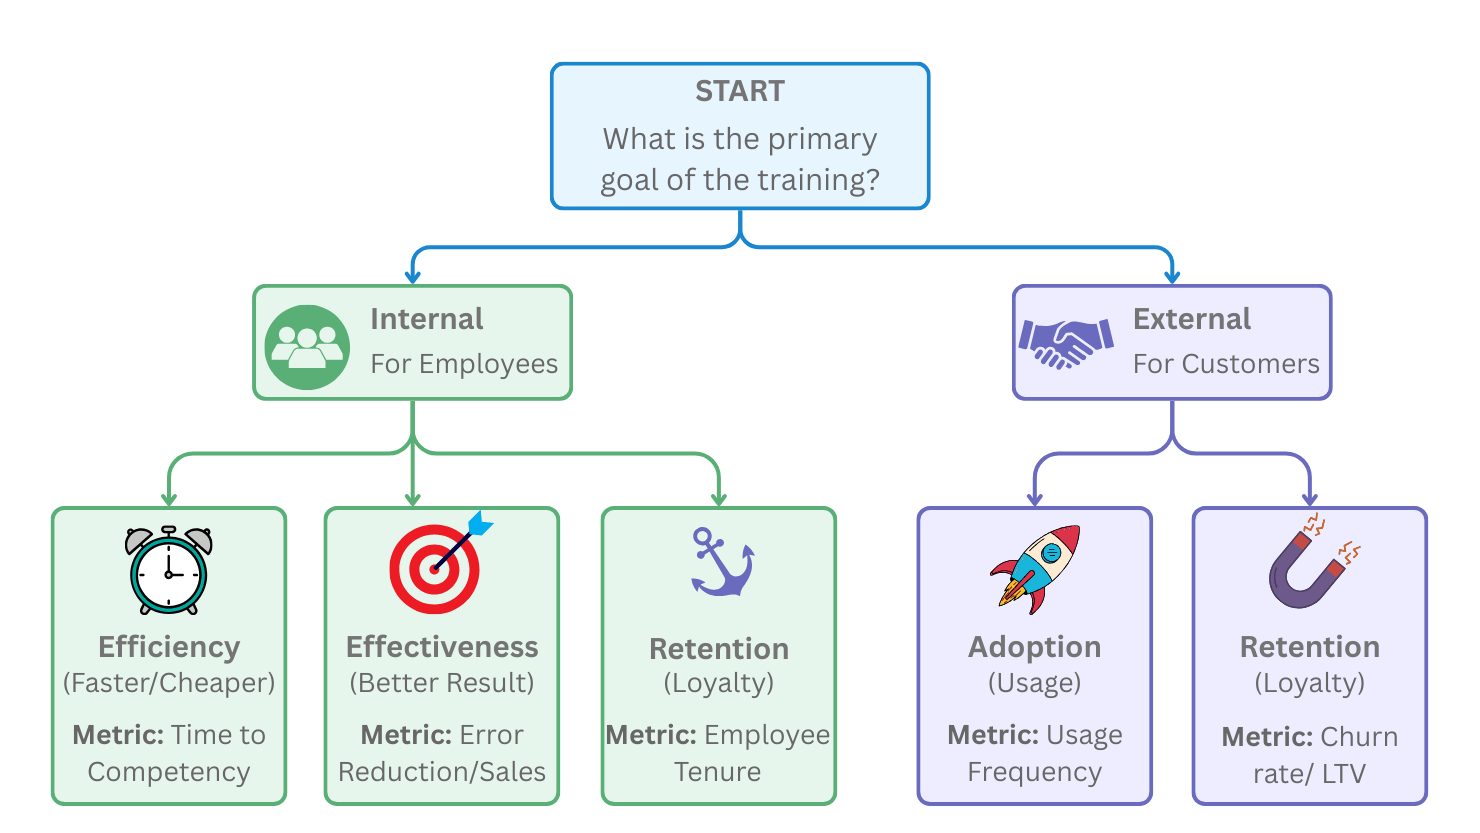
External Training (Customer)
If you are training customers about your product, you just look at product growth for ROI proofs. You will have to look at how longer customers stay with your company. Sometimes even negative profit and margin on training is acceptable if it drives core business growth.
LMS vs LRS and xAPI
LMS is the heart of eLearning, it is a centralized system which is used to create, organize, design, and deliver training programs. But when it comes to analytics you will have to look past it. LMS just provides basic data such as completion and scores for the learners, LRS on the other hand, helps you track each interaction with the help of xAPI statements.
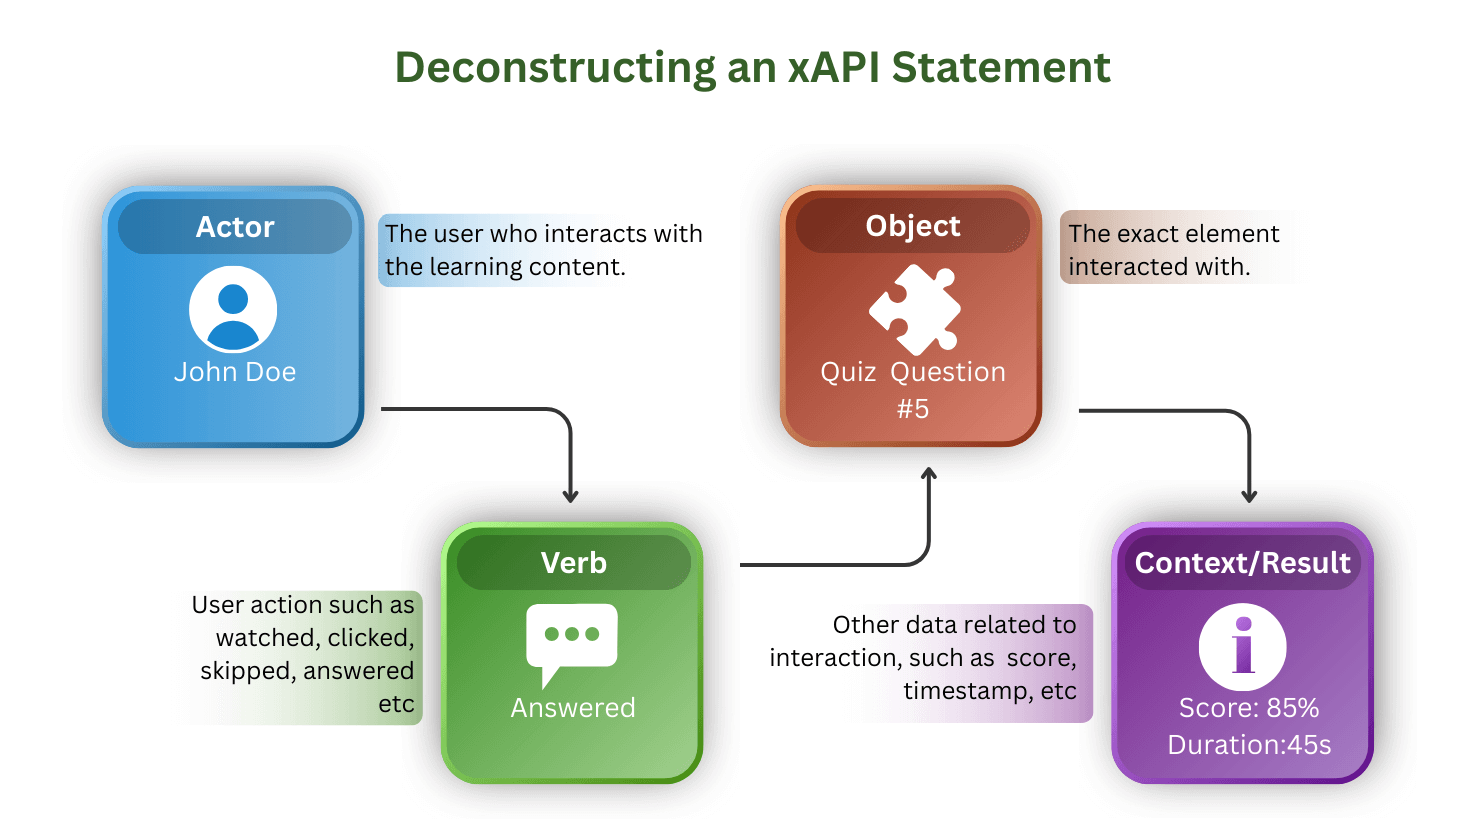
What is an xAPI statement?
xAPI statements are JSON data in the form of Actor-Verb-Object. So it will be more like user1 completed quiz 1. However, xAPI tracks more type of verbs, so you are not limited to just completion, you track more detailed interaction. And additionally it store more information about each of the interactions, such as timestamp, score, etc. So information won’t be as simple as user1 completed a quiz but while doing so, user’s each interaction will be tracked in the quiz, something like this:
- User1 started quiz (time and other data)
- User1 started question 1 (includes time and other data)
- User1 answered question 1 (includes time, answer, score, and other data)
And tracking goes on until the user completes all the questions and completes the quiz.
Now in this kind of tracking you have every granular data to understand how learners interact with your training content. You can look at where the learner is taking time. Till where they are hesitating or struggling, you can look at a large sample size of learners and compare their answers.
The Architecture of Value: How it Works
To prove ROI you will have to create an ecosystem, a data pipeline which allows correlation between training and revenue and breaks data silos. To achieve correlation you will need two tiers of insights: In-depth learning analysis for L&D teams and broad business correlation for CFO.
Tier 1: Operational Insight
Enterprise grade LRSs provide Activity stream which you can filter based on metrics such as:
- Date range
- Course
- Lesson
- Topic
- xAPI content
- Activities
- Score
- Duration
- Group
And verbs such as:
- Enrolled
- Experienced
- Answered
- Passed
- Failed
- Completed
- Paused
- Played
- Resumed
- Terminated
And visualise (bar graph, pie chart, line graph etc) with a data visualization tool provided by the LRS which lets you understand learning performance more deeply.
Such as:
- In a date range when there has been a drop in learning activity.
- In a quiz which questions are learners failing mostly.
- What lessons are attempted by the same learner multiple times.
- How much time learners have to spend before answering a particular question.
- And the list goes on.
If you are using GrassBlade LRS you get more personalized and advanced reports to analyze learning content as well as the learner. GrassBlade LRS offers more than just an activity stream. It has Reports like Quiz Report, Question Report, Video Overview, Video GradeBook, and Attempt reports. These reports take deep analysis even further.
Tier 2: Strategic Correlation
To present the ultimate proof of ROI you will have to correlate learning data (from tier 1) with the business data. To achieve this you can connect the LRS with a BI tool. In the BI tools you can map learner behavior data from LRS to Business data such as employee performance, investment, sales, customer retention, etc.
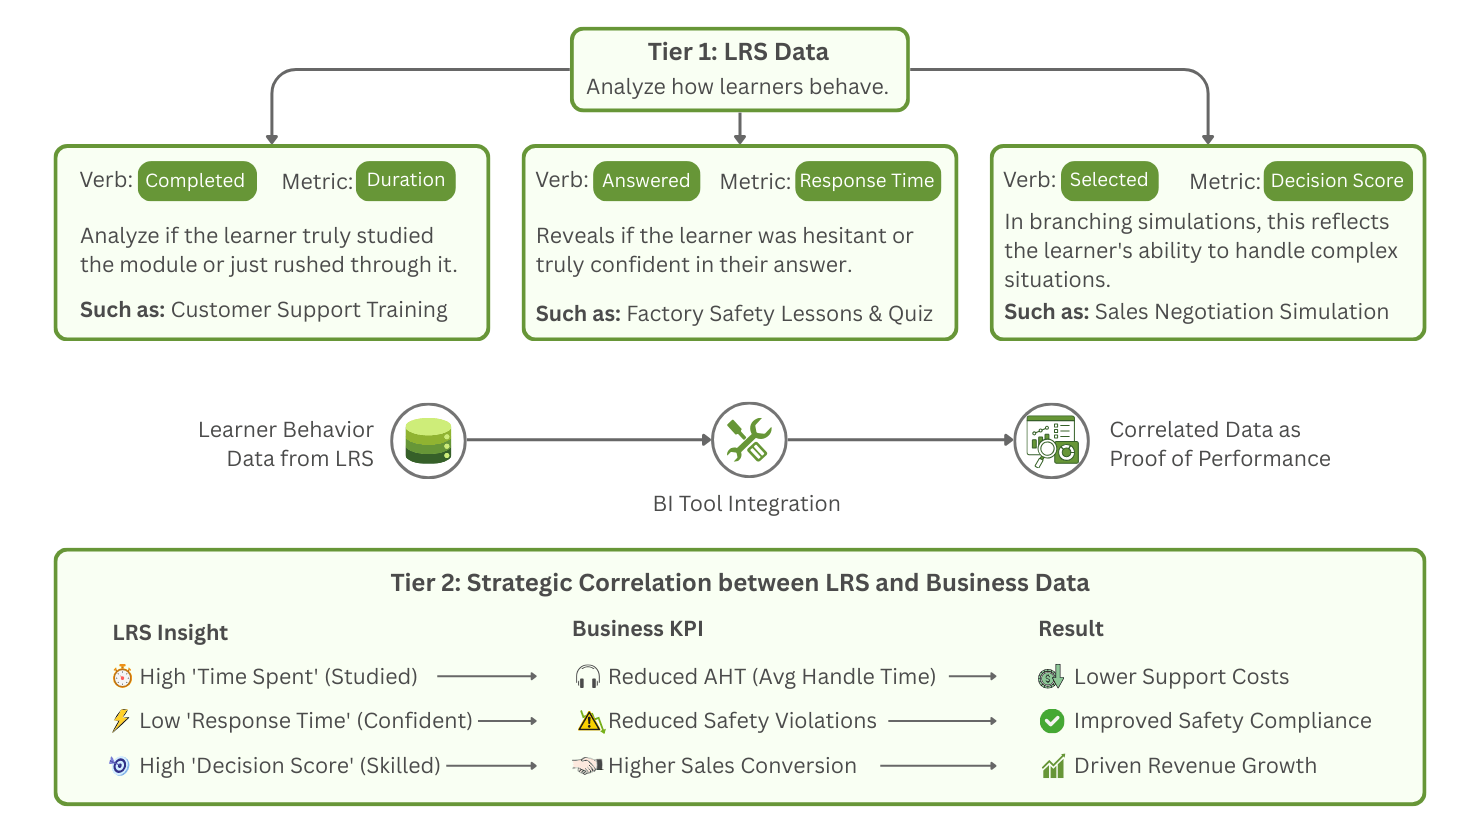
Examples of Correlating LRS Data with Business KPIs
For Efficiency
Let’s say you are training employees such as customer support agent with a training course “Advanced Troubleshooting guide”. LRS data such as “Time Spent” in a specific trouble shooting module can be correlated with business data AHT (Average Handling Time). If employees are spending more time in the training module they are more likely to resolve customer issues faster.
You can prove it with data showing negative correlation. You can show how increasing time spent on learning how to troubleshoot customer issues results in reduced AHT.
For Risk Mitigation
If a factory floor worker is provided training on Lockout/Tagout safety procedures. Metrics such as Quiz Failure Rate or Hesitation (long time taken to answer quiz’s questions) can be correlated with business data such as Workplace Accident Reports or Safety Audit Violations.
Accidents are not random, they are caused due to safety violations and knowledge gaps. High failure rate in a quiz’s question can be a leading indicator for where future accidents are more likely to occur.
For Revenue Growth
Lets say you are training a Retail Sales Associates with a course “High-Ticket Sales Simulation” which has branching scenarios where learners face a virtual customer objecting price.
LRS data such as objection handling score can be correlated with business data of conversion rate. Here objection handling score would tell if the user chose the correct response based on what the virtual customer said. And you can prove ROI using these data by comparing how learners scoring more on a specific price object scenarios in the learning content have higher conversion rates in real life sales.
Optimization
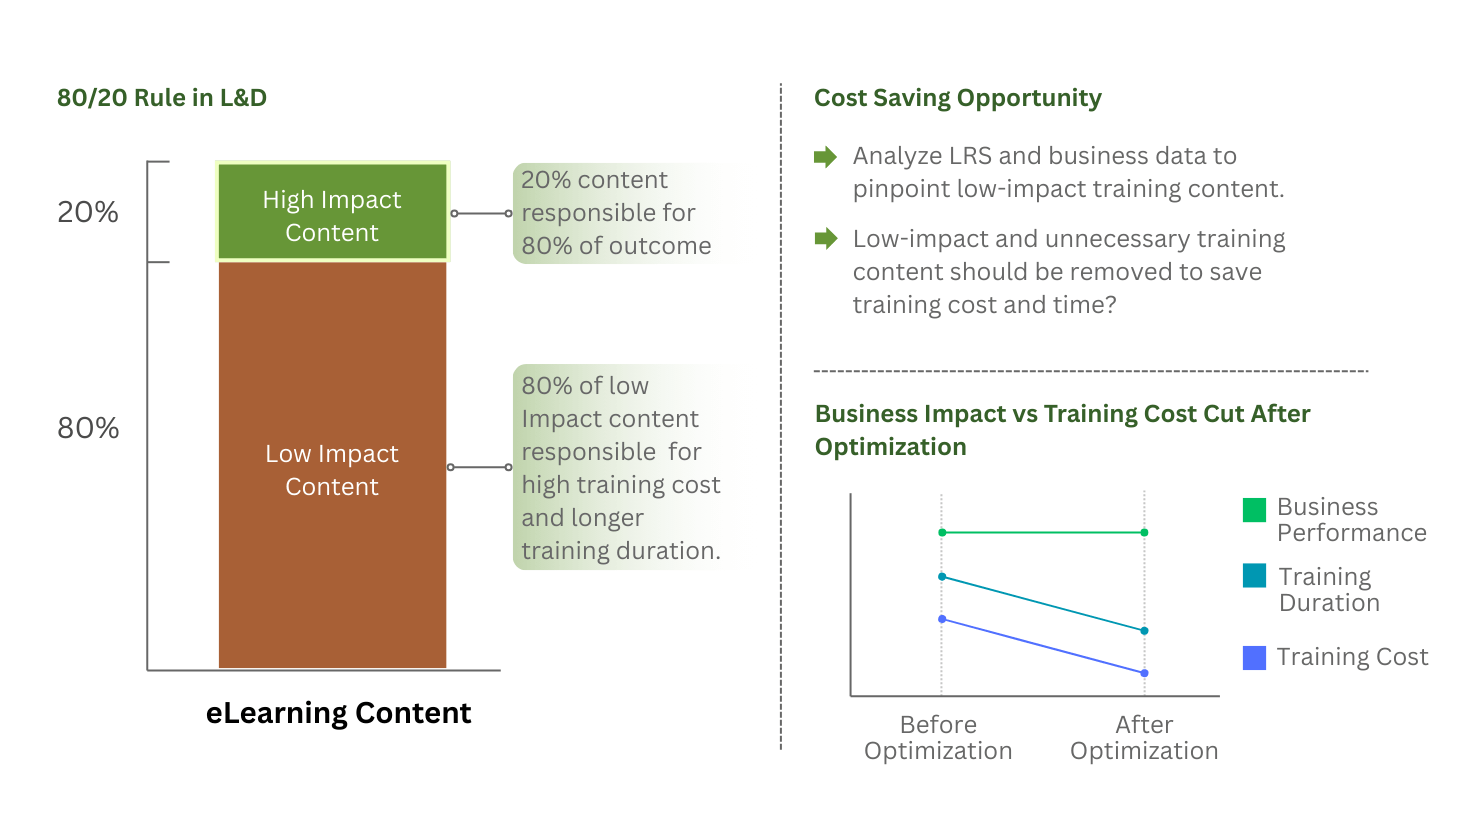
When you show a report to prove ROI to the CFO, you should optimize the data to make CFO life easier. To optimize, you can use the 80/20 rule (also known as Pareto Principle). Based on this rule 80% of the result comes from only 20% of the effort.
So In the context of Learning & Development, there is a possibility that most of the training content, up to 80% is likely useless, or may be nice to have. But they don’t actually change business performance. 20% of the training content is actually doing the heavy lifting for the business.
Identify the 20% of this data which is responsible for the improvement of the business performance. This will allow you to save money by cutting the bloat up to 80% while maintaining and improving results. Now when you show this data, it will excite the CFO as you saved the money as well as provided only relevant data.
Example: Optimizing and Cutting the Bloat
Imagine that you are training employees with a course containing 10 different modules (Product Knowledge, History of Company, CRM Training, Negotiation, etc.) and it costs the company about $5000 per employee in time and resources to deliver this.
Old Way (Without LRS): you could only report how course completion has affected the budget, and outcome. But you don’t know if all the modules had a positive impact and if all the investment is really the reason behind the outcome.
New Way (With LRS and Optimization): When you correlate the granular module data with sales figures, you may find out that only a few modules such as (Negotiation and CRM Training etc) are responsible for positive sales outcomes.
You apply the 80/20 rules and cut some of the modules from the training content which reduces almost 50%-80% of the cost and instead of spending $5000 now it costs the company about $1000-$2000 to train the employee.
Conclusion
In a data driven business environment the CFO needs proof, not promises. By incorporating technologies such as xAPI and LRS (Learning Record Store) you transform your simple module completion and score based LMS data to Tracking micro interactions,behaviors and granular data which gives you ability to answer hard questions.
These technologies not only allow you to prove ROI but also help you reduce unnecessary expenditure by eliminating ineffective training investment and time.
When you prove exactly which training activities are driving revenue and when you cut the ones that are just costing money for nothing, You stop being viewed as a budget line item that needs to be managed. Instead, you position Learning and Development as a strategic partner that drives profitability. This is the language every CFO understands.