A standout feature of GrassBlade xAPI Companion has been its video reporting powered by LRS data. Now, all video reports are accessible directly within GrassBlade LRS, offering in-depth analysis of your video-based learning content.

Video Reports are available at Reports->Video Reports. Here you can build different video reports such as Overview, Attempts and Gradebook report.
Video Overview Report
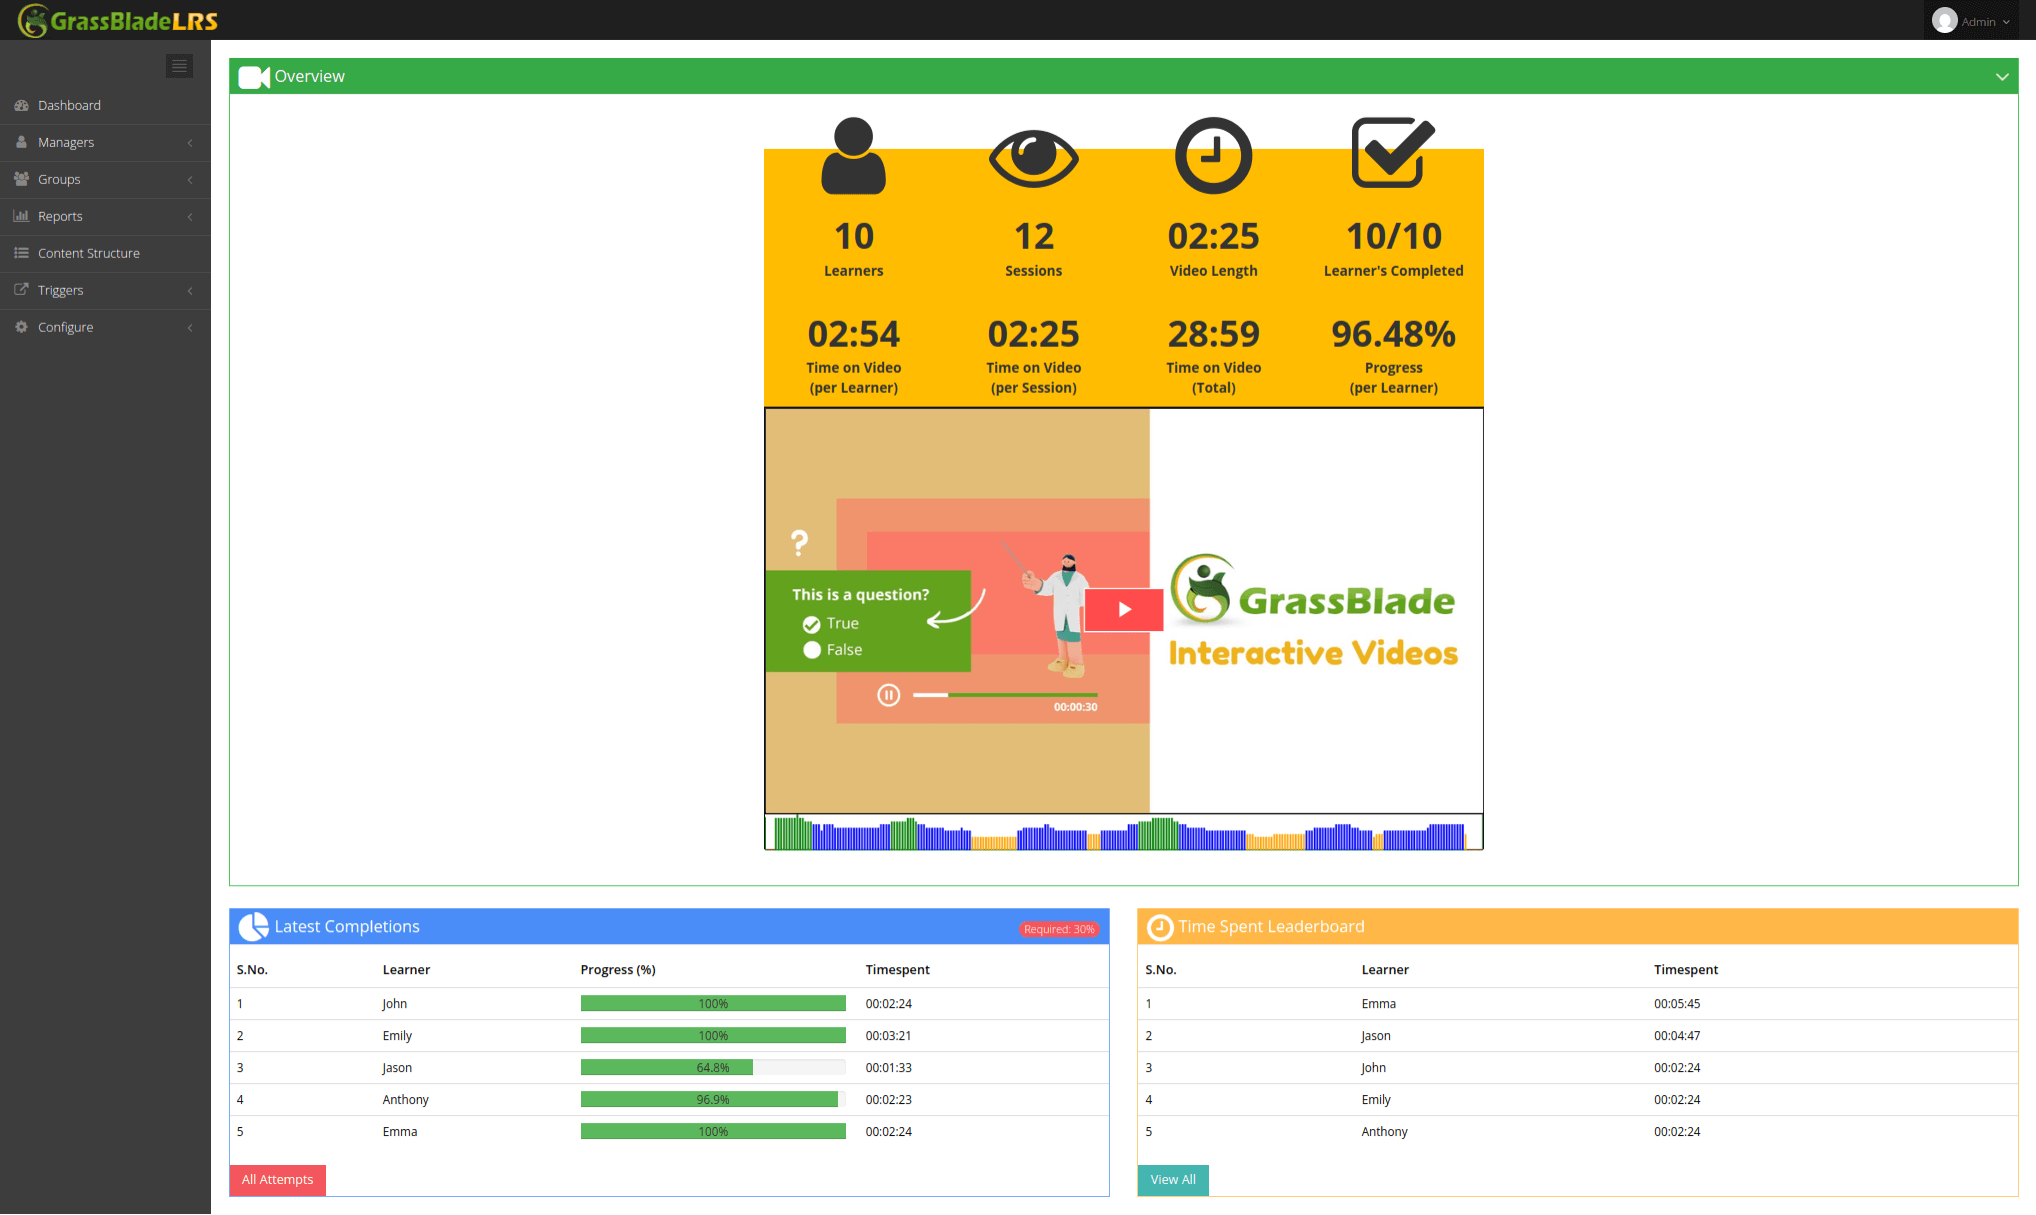
The Overview report provides a summary of learner engagement with the selected video. Administrators and group leaders can tailor the data by applying filters for specific learners or groups to suit their unique requirements. This report includes the following key insights:
- Total number of learners who watched the video
- Total viewing sessions
- Length of the video
- Number of learners who completed the video
- Average watch duration per learner
- Average watch duration per session
- Total watch time
- Individual learner progress
Video Attempts Report

The Attempts Report provides detailed insights into each learner’s interaction with a specific video, offering instructors valuable data on engagement and progress.
You can explore:
- The start and completion times for each learner
- Total time spent on the video by individual learners
- Heatmap visualization showing which parts of the video were watched and for how long—helpful for identifying challenging or confusing sections
- The percentage of the video completed by each learner
Video Gradebook Report
Click to Expand
Heatmap
Attempts

Time Spent
Percentage Watched
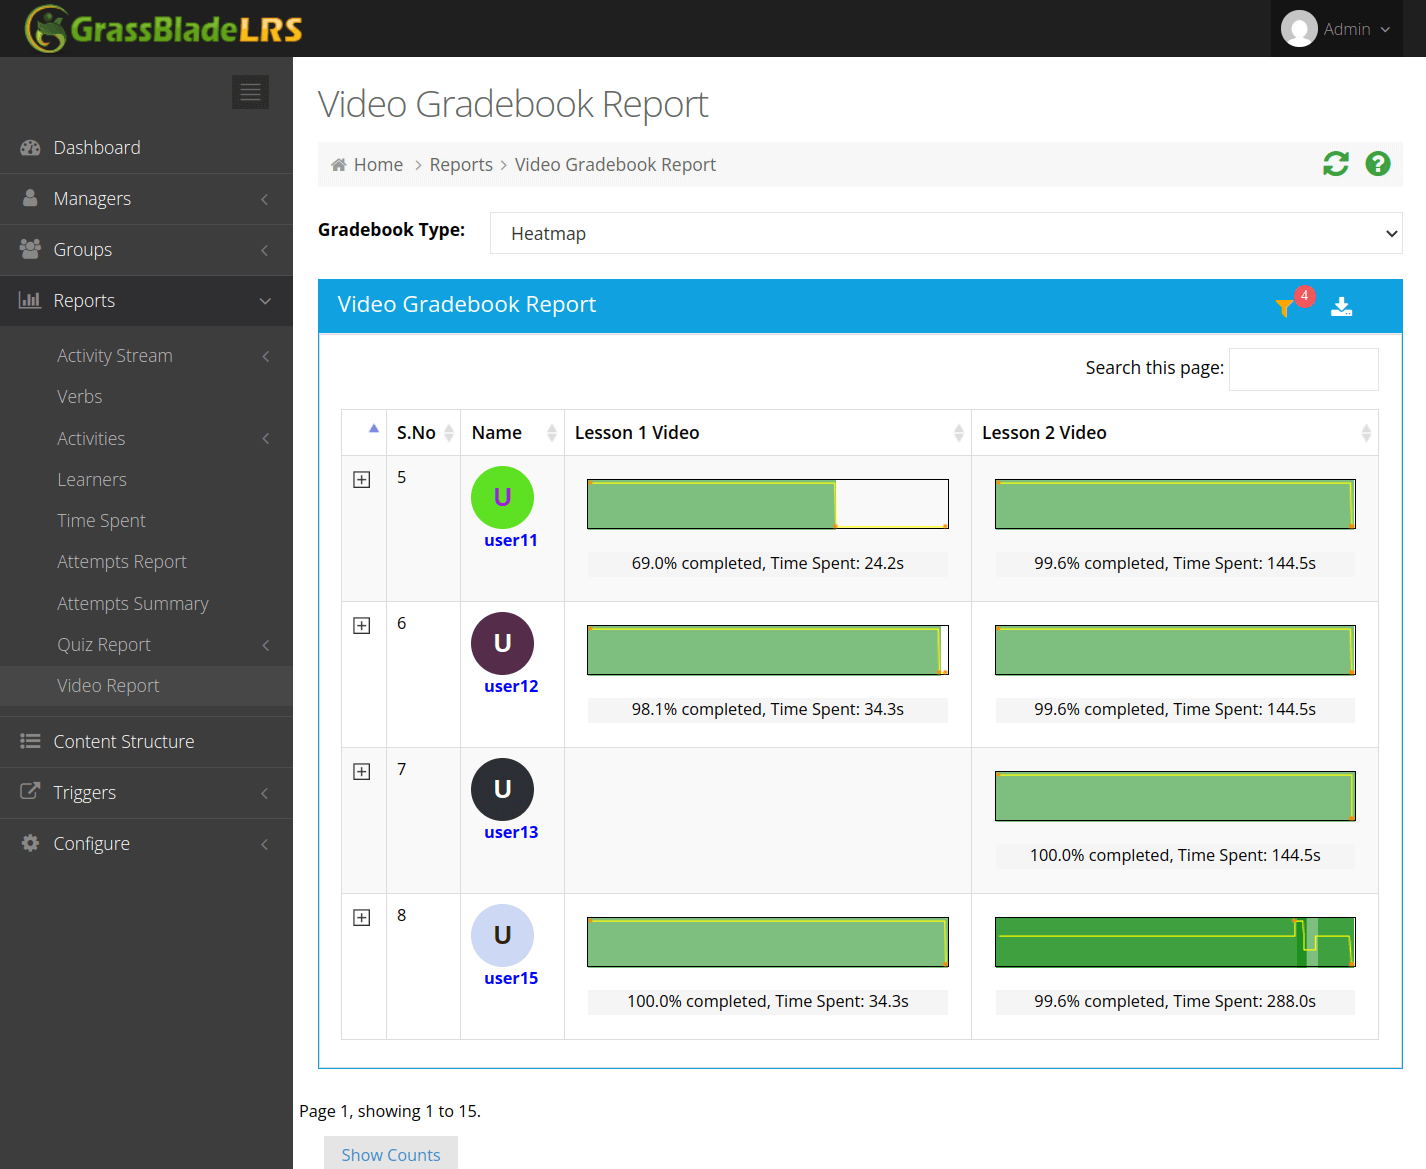
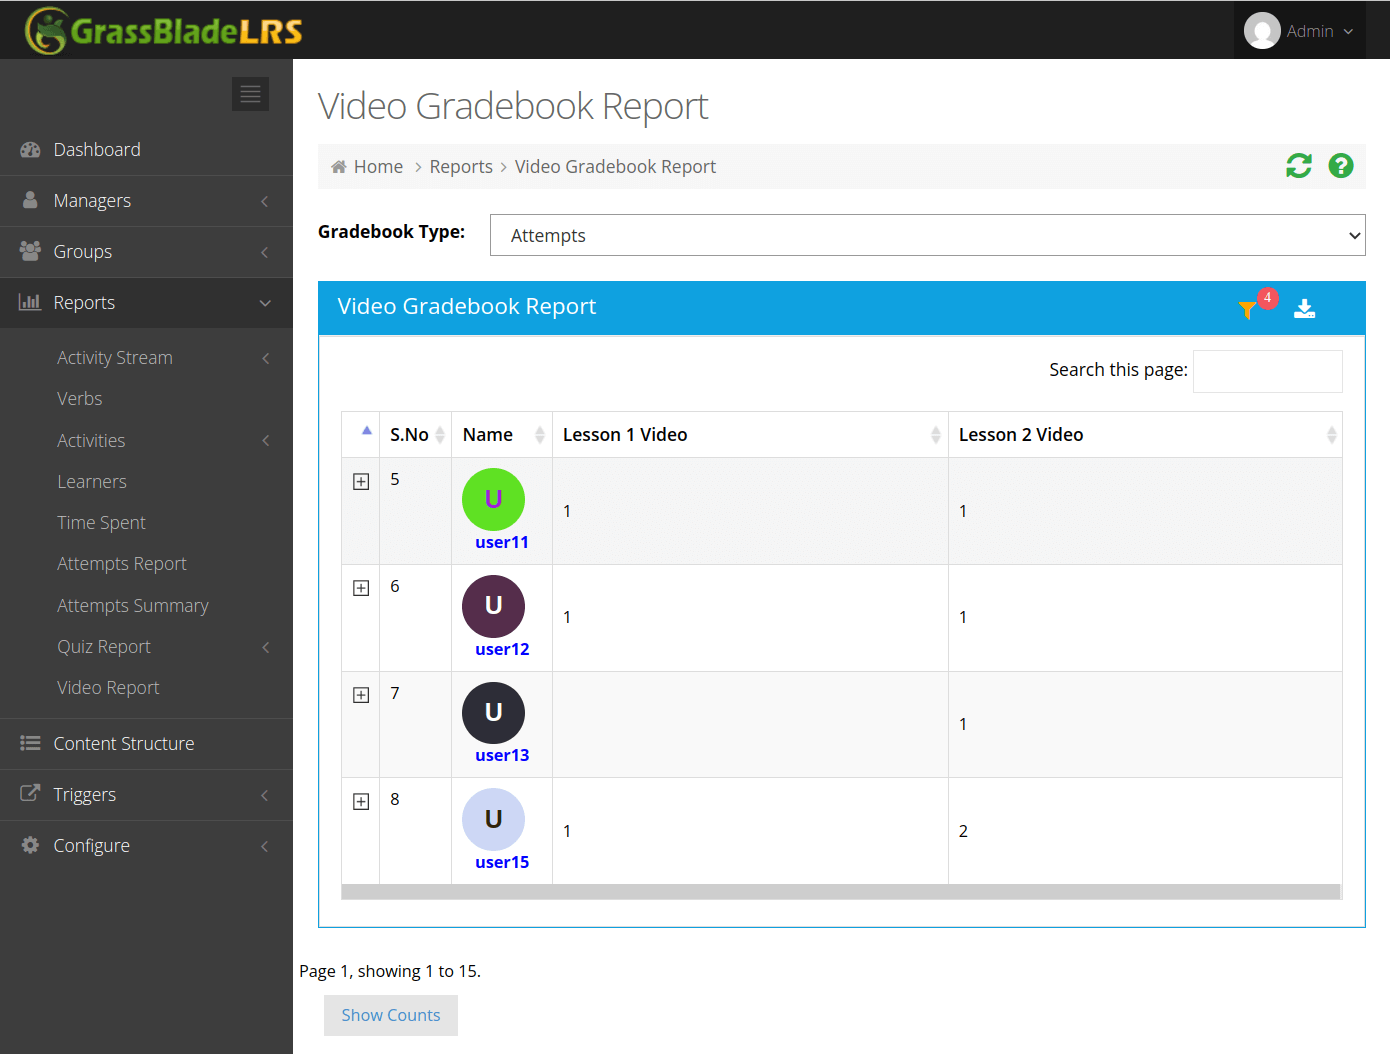
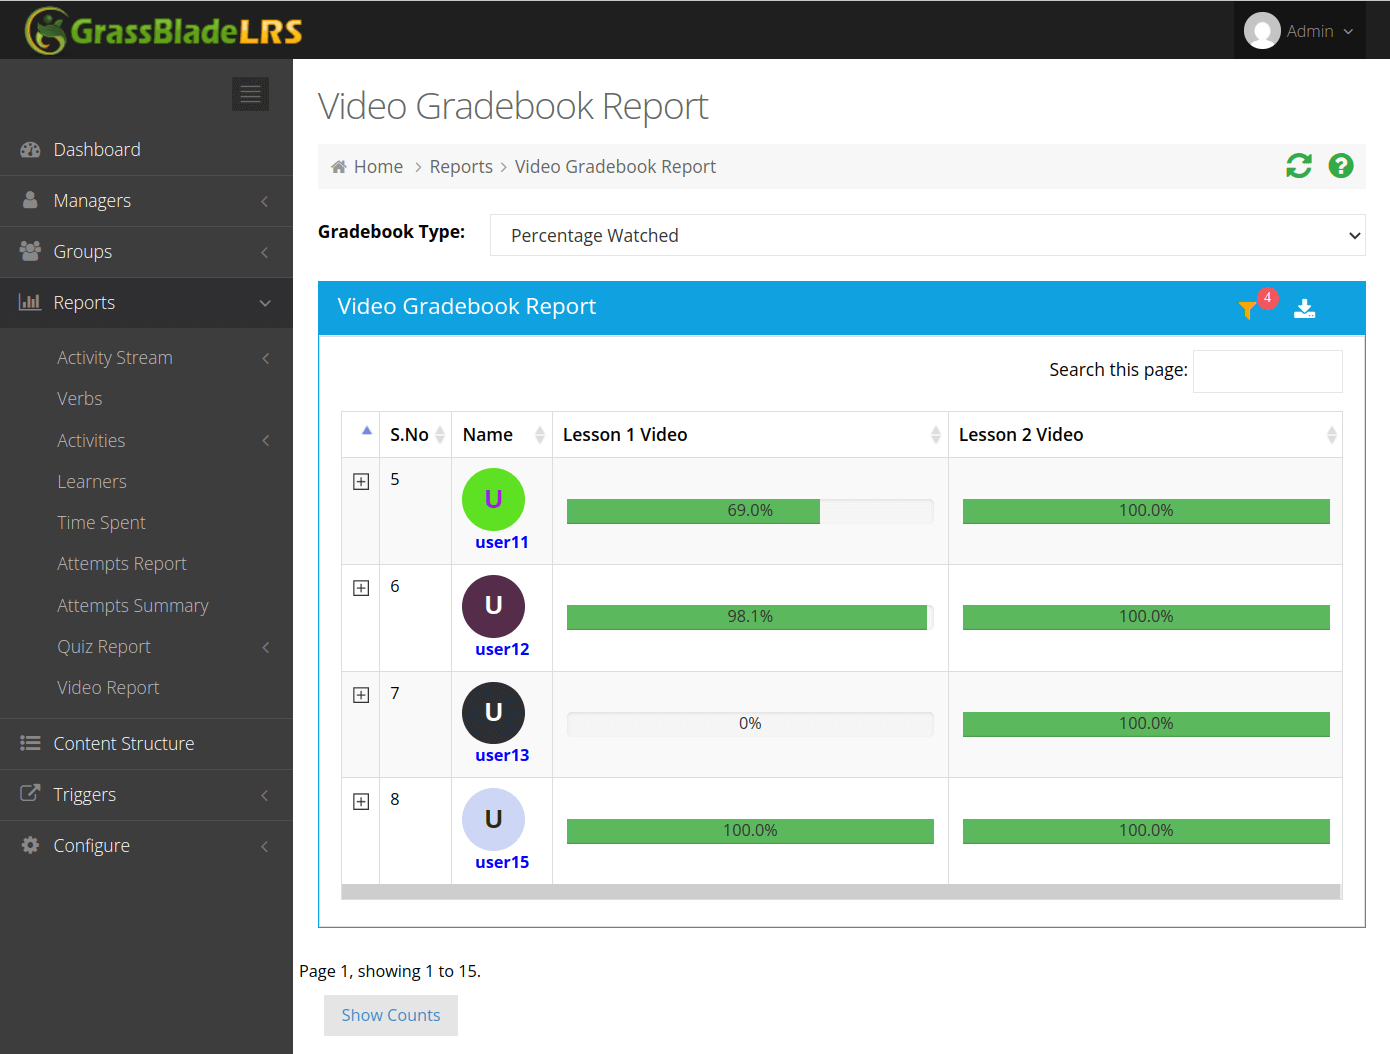
The Video Gradebook Report consolidates key engagement metrics for selected videos and presents them in a gradebook-style format. This makes it easier to compare learner engagement and performance across videos more effectively.
The Gradebook Report lets you evaluate and compare the following metrics:
- Heatmap – A visual breakdown of which parts of the video were watched and for how long, helping identify potentially confusing or difficult sections
- Number of Attempts
- Time Spent per video
- Percentage of Video Watched
Conclusion
These reports help you understand how learners have been progressing and if your video lessons are working well or not. You can even learn at which part learners has to repeat the video to understand it properly. These kind of information help you improve your learning content and get better result.